W
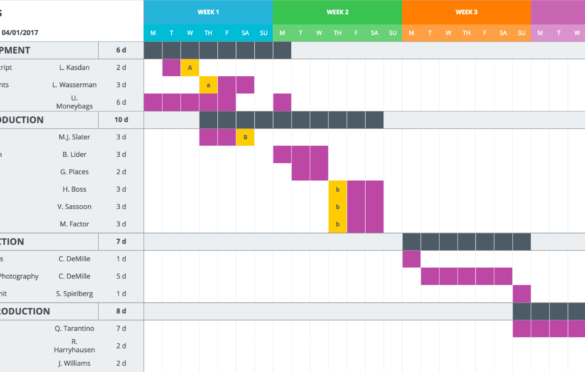
e all know that production is messy. Put a bunch of people in a room and you’re lucky if you can organize what to get for lunch. That’s where our Gantt chart Excel template comes in.
Are you not familiar with Gantt charts? We think you’ll be glad to know them. This visual project planning template gives you a quick and easy overview of how long each stage of a project is scheduled to last.
Download our free Gantt chart Excel template and we’ll teach you how to make a Gantt chart in Excel or a Google Docs Gantt chart today!
1. Gantt chart
What is a Gantt chart?
Fundamentally, a Gantt chart is a bar chart where each bar represents the start and finish dates of every event or task. It can be used as a team calendar, a project calendar, or both depending on your needs.
Here’s a rough Google Sheets Gantt chart example.
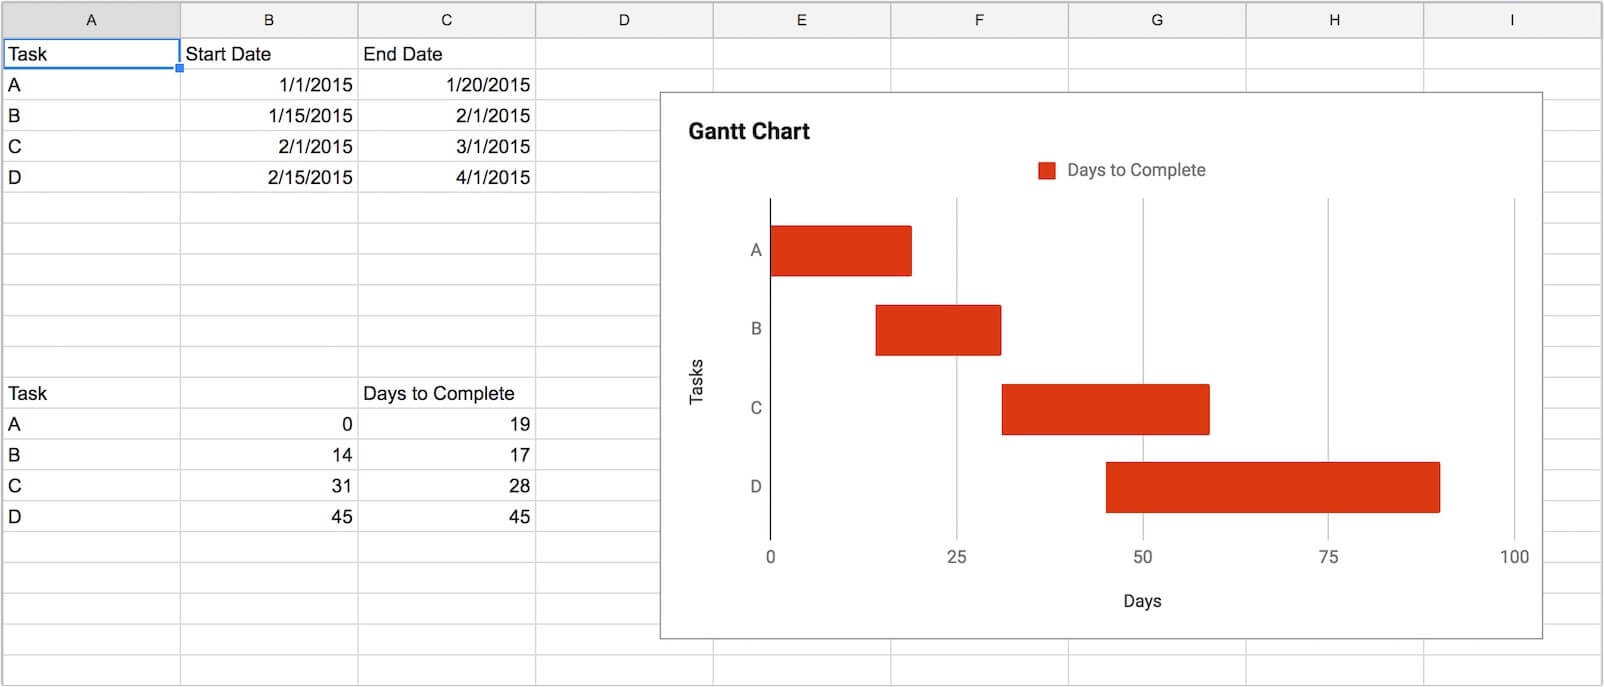
This example Gantt chart Excel template is more suited for small projects.
It’s fine if you just need rough estimates for simple projects, but isn’t really full-featured enough for film and video production.
Each task has a bar associated with it. The bar begins when the task begins and ends when the task is due to end. For the purposes of production, it can be broken up by department or major tasks.
You can even break your project planning template by which stage of production you’re in:
- Development
- Pre-Production
- Production
- Post-Production
- Distribution
Another major feature of Gantt charts, including our free Excel Gantt chart template, is their ability to display “dependencies”.
A dependency is simply a marker that one event cannot begin until another one has been completed.
Here’s a Gantt chart example from the film production world.
Let’s say that you’ve started the pre-production process. You’ve got casting scheduled for the second week of June.
You also need to get started on location scouting, and you’d like to have a table reading before you go any further.
Casting and location scouting are independent of each other. You don’t need to have the film cast to start checking out potential locations.
However, casting and the table read are dependencies. The table read is dependent upon casting being finished. You can’t have a really productive table read until you have all your cast finalized, after all.
History of Gantt charts
Gantt charts have been around since the turn of the century. They were designed by mechanical engineer Henry Gantt in the 1910’s as a personal project planning template.
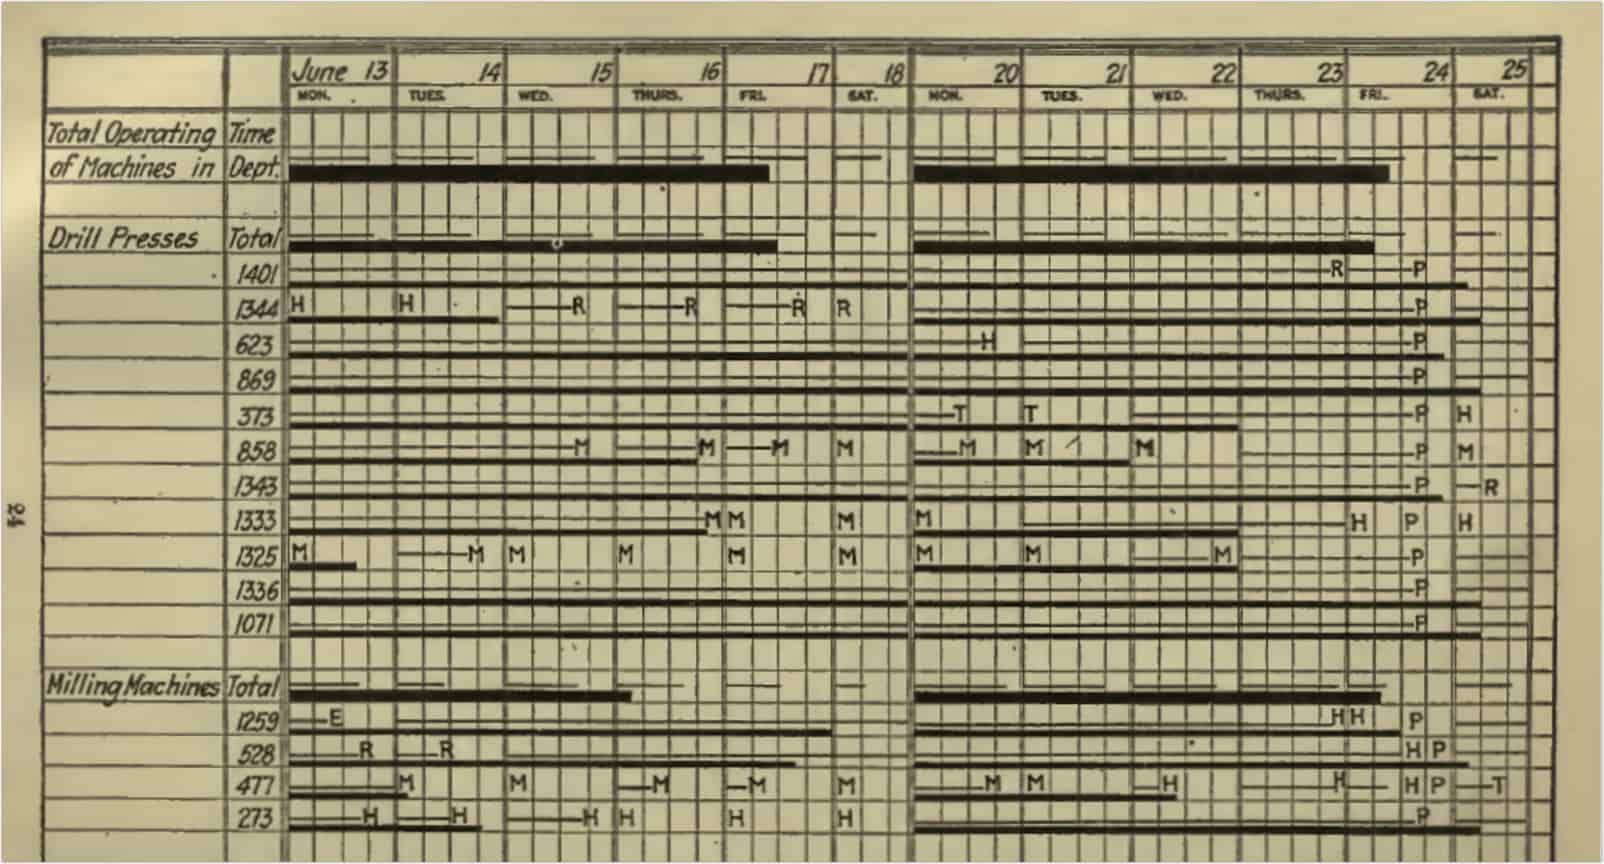
An example Gantt chart from the 1920’s. Just to give you a sense of history.
A similar project calendar system called a harmonogram was designed in the 1890’s by a Polish engineer named Karol Adamiecki, but it wasn’t published until the 1930’s. And then only in Polish.
So they never really caught on.
When other project planning systems weren’t up to the job, Gantt charts were used during WWI to track the manufacture of arms for the war effort. Other example Gantt chart efforts include the Hoover Dam and the Federal Interstate system.
The personal computer revolution of the 1980’s brought Gantt charts to the forefront in a big way. Rather than having to draw a new Gantt chart each time, a new project management spreadsheet could be easily copied as needed.
Learning how to make a Gantt chart in Excel wasn’t far behind.
The dawn of the Internet age of the 90’s and the 2000’s brought Gantt charts even further. Now it could be shared and viewed collaboratively, a true team calendar. A Google Docs Gantt Chart was just a few mouse clicks away.
Advantages of Gantt charts
Compared to traditional project calendars or schedules, Gantt charts offer a few distinct advantages as project planning templates.
The first is that they’re visual project calendars. You can look at any example Gantt chart, even without dates, and quickly see the basic layout of the project. What step will take the longest, which will be done relatively quickly.
Attempting this same sort of high-level view would be almost impossible on a traditional calendar, which is focused on the given day.
The second is that they’re project planning templates, not just simple schedules. Gantt charts break a project down into distinct phases and tasks.
Rather than just see that you have a three-week Pre-Production scheduled, you can quickly see that that three-week Pre-Production is composed of two weeks of casting, two weeks of costume fitting, one week of location scouting, and one week of set design.
All layered on top of each other, of course.
Good luck getting that kind of information out of any other project planning template.
Thirdly, although by no means finally, Gantt charts are holistic. Holistic is generally defined as understanding that everything is connected.
Gantt charts are project management spreadsheets that specialize in a visual view. They give you an intuitive understanding of how everything fits together.
This is especially true when you start using dependencies with our free Excel Gantt chart template. The unfortunate truth is that in any project, you will have to delay deadlines and add extra time for unexpected circumstances.
Gantt charts let you see how changing one thing affects everything else.
Related Posts
2. Create Gantt chart in Excel
How to make a simple Gantt chart in Excel?
So we’ve convinced you.
You’ve seen a few Gantt chart examples. You want to jump straight into creating your production calendar, but you’re not immediately sure how to get started.
Fear not, we’re here to help.
First things first, download our Gantt chart Excel template. It’s actually a Google Docs Gantt Chart, so if you prefer, you can make a copy to your own Google Drive.
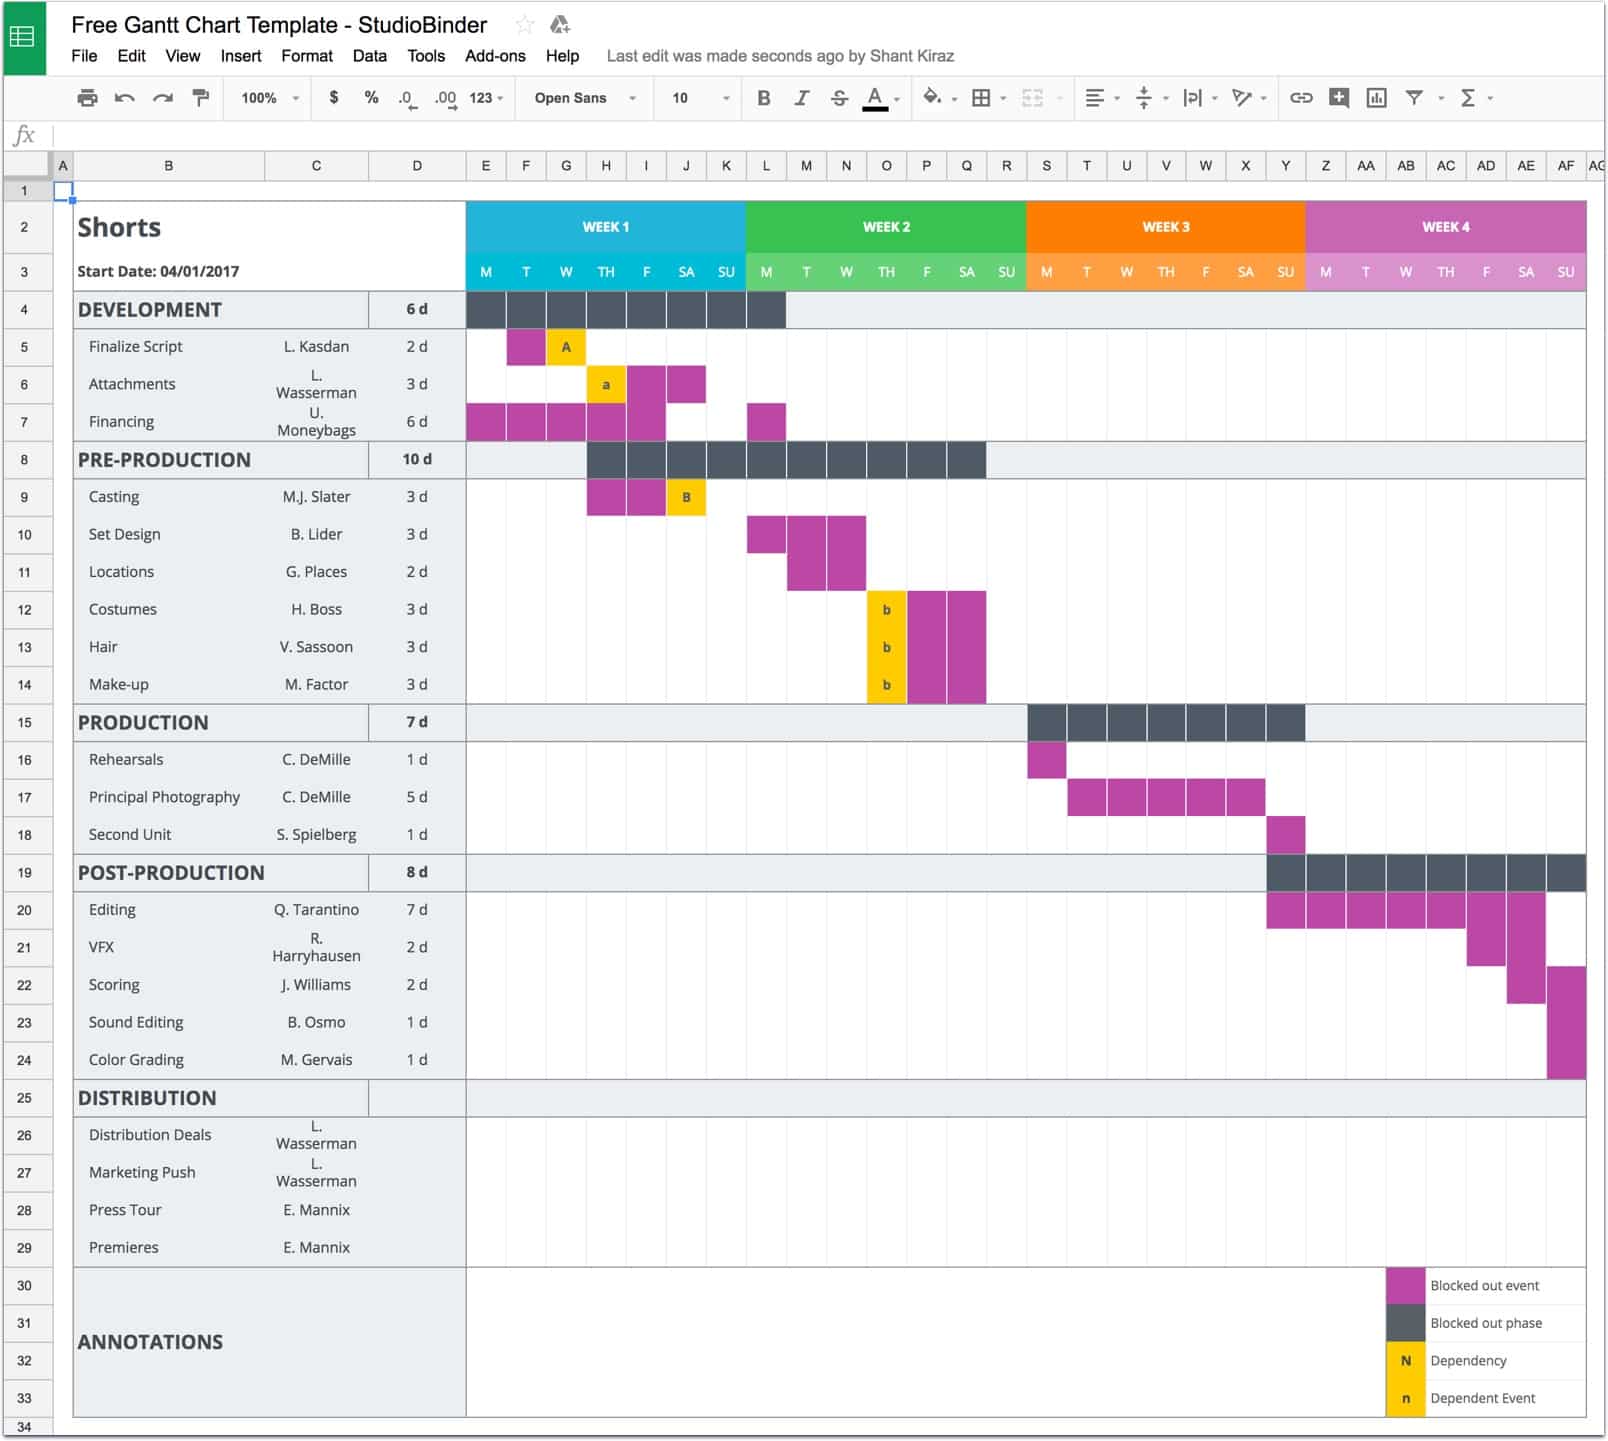
What your production calendar should look like
Either way, we’ll wait.
Done? Fantastic. Let’s do this.
Filling in a Gantt chart
The next step, after downloading our free Excel Gantt chart template, is to give everything an appropriate label. The name of the project, the company or studio you’re working for, the start date, etc.
Then go ahead and label the distinct phases of your production. We’ve gone ahead and labeled them for you with the five most common phases of film production, but your needs may be different.
Then go in and label each task that is relevant for each phase. Again, we’ve filled out some common needs, but yours may be different.
If you want to ADD additional lines, select a number in the middle of the appropriate phase. We suggest the middle to help prevent formatting headaches.
Right-click and select “Insert 1 Above” or “Insert 1 Below”
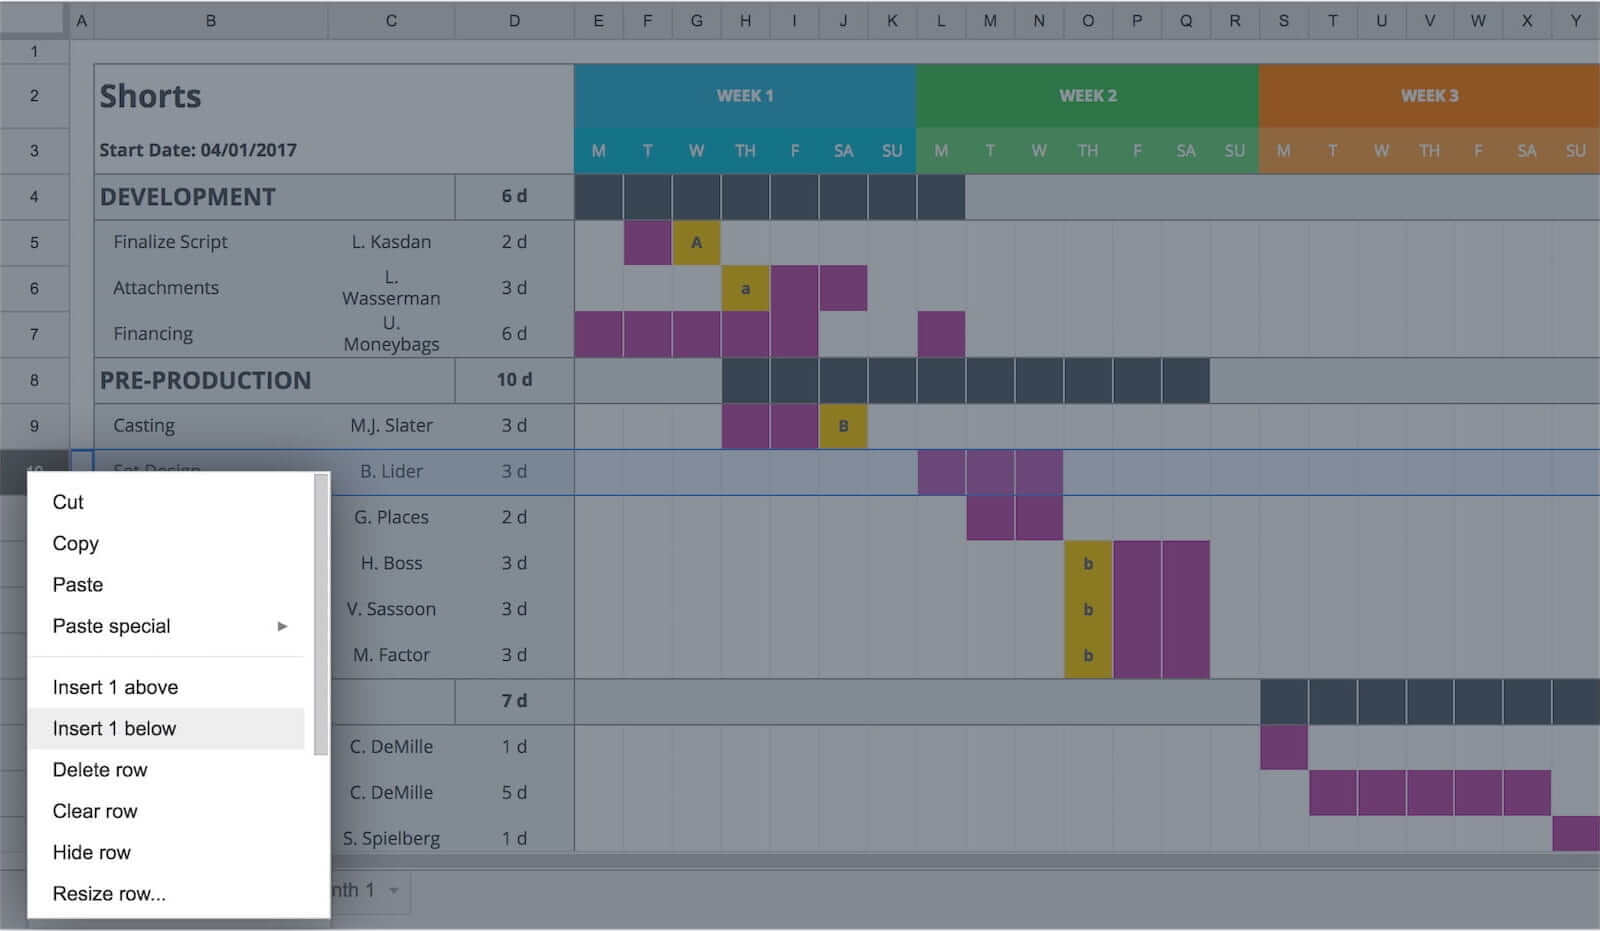
Just right-click on the row to view the list of options on your Gantt chart template
Don’t worry about having forgotten something. It’s easy to add new lines when you need them.
Now, since this is a team calendar, you’ll want to assign an owner to each task or department. This is the person who is in charge of the task. If you’re making this as a Google Sheets Gantt chart, you’ll also want to share the document with them.
For some of these, it will be relatively easy. The casting director is in charge of casting, while the location scout is in charge of locations.
Some of the more general tasks we’ve put into our Gantt chart Excel template, like “principal photography”, might not have an obvious person to make their owner. You might think the director. After all, they’re in charge of the set.
But this is more about who’s in charge of keeping logistical track of the set. Depending on your shoot, this could be your director or could be your 1st AD, Line Producer, or Unit Production Manager.
Determine the timeline
Now it’s time to determine the overall timeline of this project calendar. Is this a short that can be wrapped up two weeks? An indie feature that needs several? Or are you spending two years making the next fantasy epic trilogy?
Some of these decisions will be enforced on you by external events. You might have a hard release date set by the studio. You might be only able to secure the commitment of your star for a set number of months.
And of course, there’s the ever-present specter of the budget hanging over everything. You may only have enough money to do this in six months.
Our Gantt chart Excel template comes in four-week increments or roughly one month. Admittedly, the calendar months will occasionally run five weeks, but for the purposes of our Gantt chart example, this approximation should suffice.
The easiest way to add more time is to duplicate the calendar into a new sheet. Simply go down to the tab labeled “Month 1”. Click on the arrow next to it and select “duplicate”.
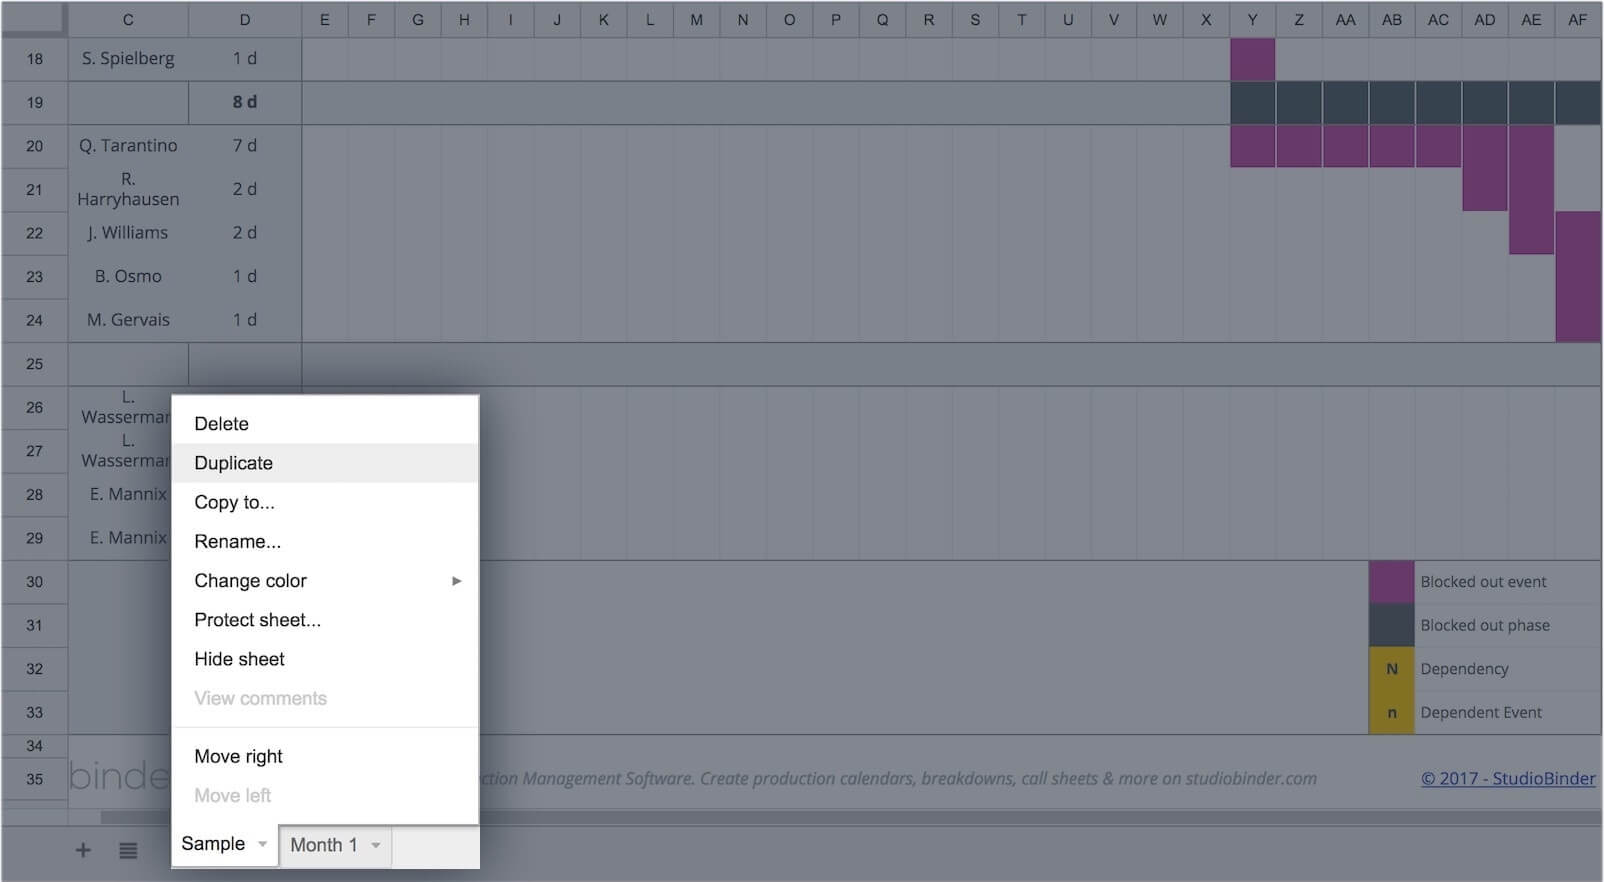
When you click the triangle, click Duplicate to copy over a new sheet
Rename the calendar to reflect which month it covers, then go in and re-number each week. Do this as many times as is necessary for your production.
Add dates to your project planning template
The next step is to fill out your estimated timelines for each task. For the time being, you’ll be relying on your experience, the experience of your department heads, and good old-fashioned guesswork to figure this out.
It can, and probably will start to change as the rubber hits the road.
Those same external factors that helped set your initial timeline will also come into play here. If you can only secure your star for three weeks, then you’re looking at a three-week production.
To add tasks, select the days you want to block out on the appropriate line. Select the “Fill color” icon. It’s the one that looks like a paint can. We’ve created a suggested legend for you at the bottom, but you can change it based on your needs.
As production rarely maps neatly onto the standard five-day work week, we’ve included all seven days of the week in our Gantt chart Excel template. Keep in mind labor laws and what kind of work week you’ll be using as you fill it in.
You may have to create multiple bars on the same line.
This allows you to roll easily from one week to another for particularly long tasks, such as principal photography. If you need to roll onto next month, jump onto the next sheet and continue as is necessary.
After you’ve selected your dates, go back to the column marked “duration” and enter in, well, the duration of the task. The base measurement is in days, but for particularly long tasks, it may be more efficient to indicate the number of weeks.
Once you have ever task planned out, it’s time to indicate the length of each phase of production.
On the bar next to each phase (development, pre-production, etc) select the cell directly above the first task in the phase. Stretch all the way down until the end of the last task.
Now go back up to that fill icon and select and select a color to indicate the length of each phase. Again, we’ve suggested a sample color for you, but you pick what works for you.
Under phase “Duration”, put down the entire length of that phase, including non-working days like weekdays and holidays.
Congrats! You’ve filled out your production in a Google Sheets Gantt chart. Take a nice sip of tea. You’ve earned it.
Optional: Add dependencies
This step isn’t necessary, strictly speaking. But if you believe yourself to be a project management spreadsheet master, you can also use our Gantt chart Excel template to create dependencies.
The first step is to identify which events are themselves dependencies. What needs to be finished before something else can begin?
Dependencies work best when you’re specific. There are a lot of things that need to be finished before production can begin, so calling all of those out as dependencies won’t help your project planning template all that much.
Two good rules of thumb when deciding on whether tasks are dependent:
- If I had to delay the first task, would I have to delay the second task just as much?
- Would it be obvious that I had to delay that second task?
If the answer to the first question is “Yes” and the second is “No”, you’ve got dependent tasks on your hands.
To mark those out on our Gantt chart Excel template, we first go to the last day of the first task. Go back to our old friend the fill color and choose a color (we suggest a yellow in our legend). Now enter a capital letter. Start with “A” and work your way down through the alphabet.
If by some miracle you make it all the way through “Z”, move on to “AA”. And seriously consider trying out our Production Calendar software, because that might be too much to ask of any project management spreadsheet.
Now, find the second event (the “dependent event”). Color the first day the same color as before. Enter the same letter, but this time, make it lower case.
So, for example, if you put “A” on the last day of your first event, you’d put “a” in the first day of your dependent event.
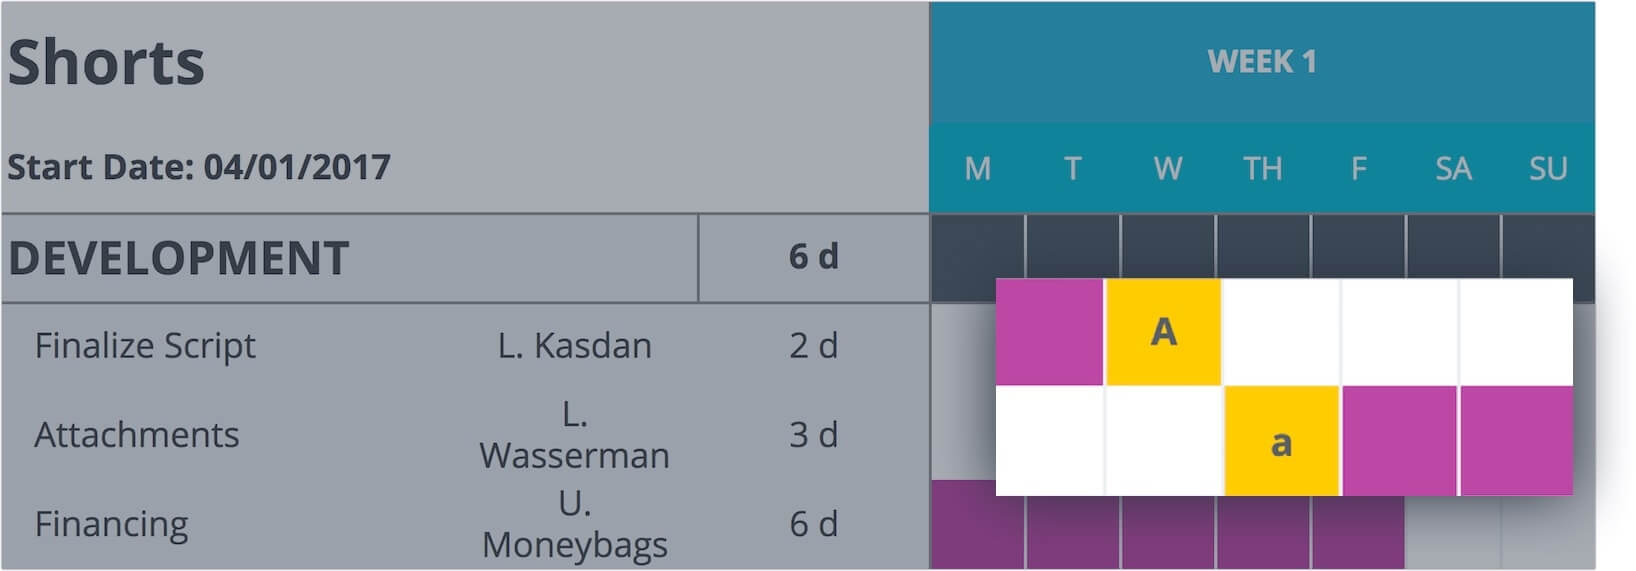
What a dependency looks like on your production calendar
Optional: Annotations
We’ve created a space at the bottom of our Gantt chart Excel Template for you to add any notes or annotations that you require as you fill out your chart.
Simply put a number on the day in question and make a note in the annotation section. Some things you might want to put there include:
- Changes in shooting location
- Delays
- Hard deadlines
Or really any notes you feel are necessary for your production.
3. Revising your Gantt chart
Revising your Gantt chart Excel Template
One of the most important things to remember about our Gantt chart Excel template is that it is by no means set in stone. Nor is it meant to serve as a replacement for a shooting schedule, which is far more detailed than the Gantt chart.
Our project planning template is designed with flexible schedules in mind. Right now at the start of everything, you’re so far out that you can’t possibly know how long certain tasks will take.
The editor will give you the accurate estimate of how long the first cut will take once you give him all the footage. Change your estimate accordingly, and reckon how this will change everything else.
It’s also important to remember that this is a team calendar. You want to keep your team updated. If you’re using a Google Docs Gantt chart, share it with your crew and make sure they have change notifications turned on.
FREE Download: Gantt Chart Template
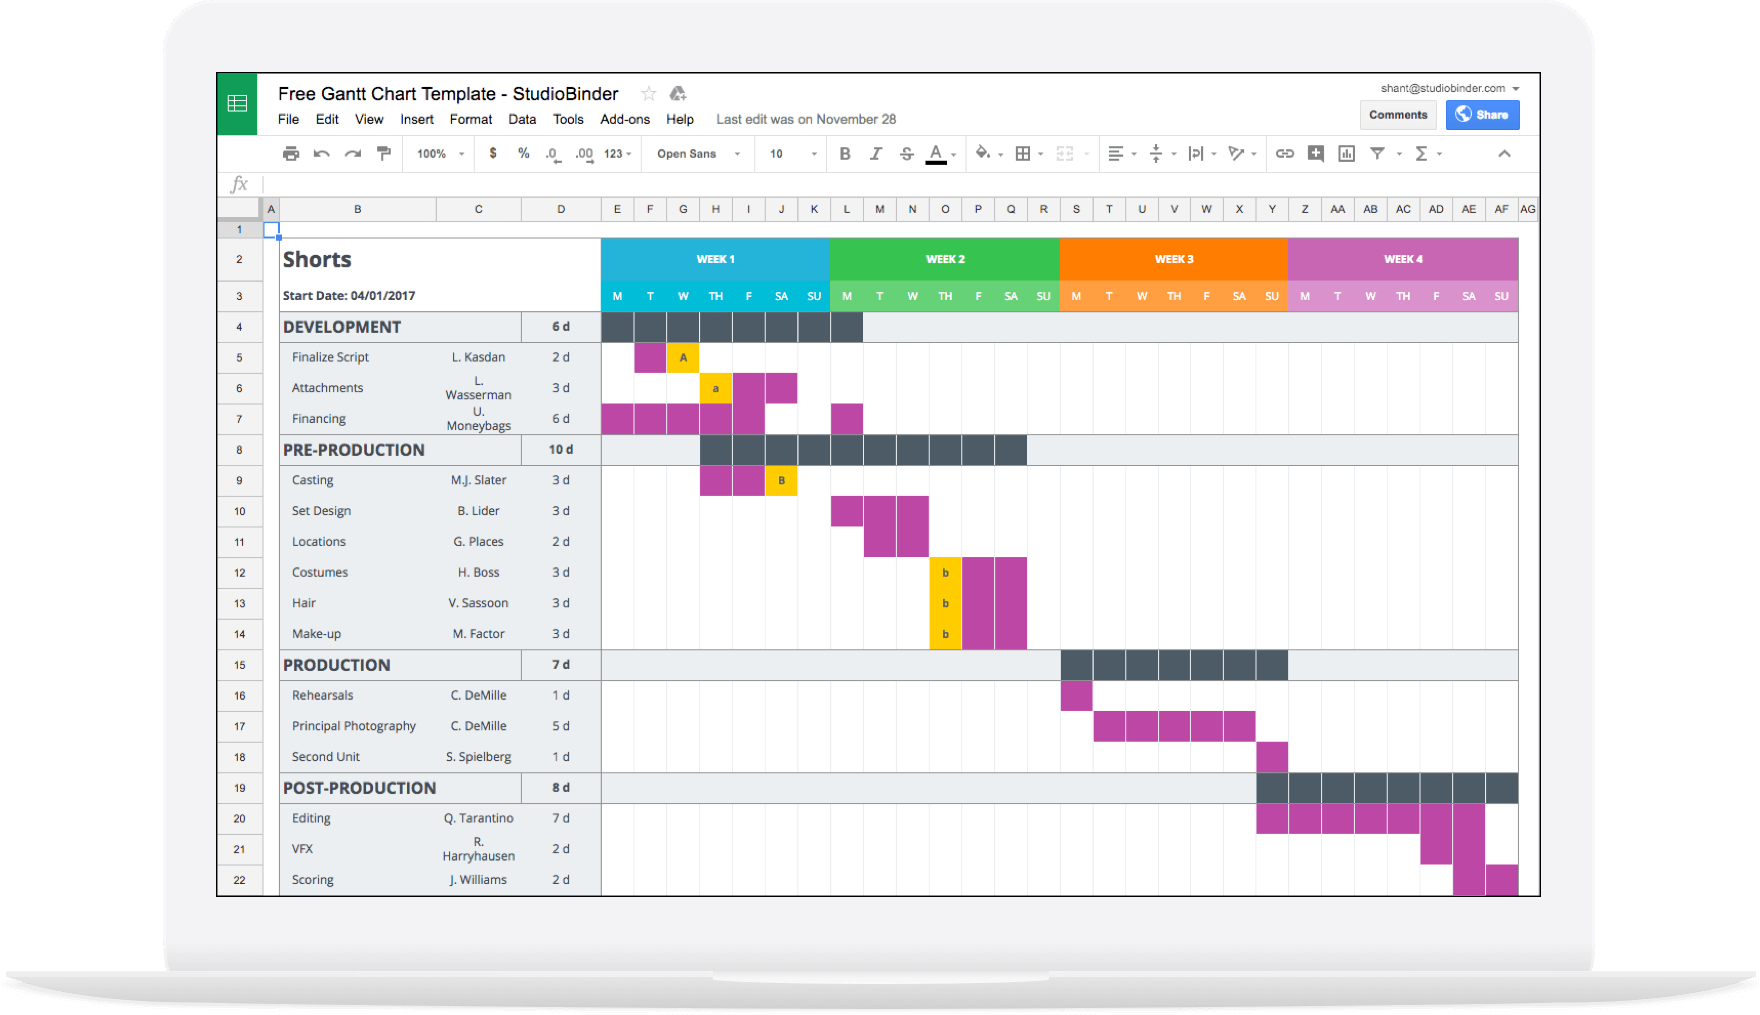
Download your FREE Gantt chart template.
Just enter your email address and we'll instantly send it to you!
Up Next
Conclusion
Gantt charts have a long, rich history. With them, people have tamed nature and built impossible things.
And with the help of our free Excel Gantt chart template, you now know how to make a Gantt chart in Excel yourself. Or you can copy it and make a Google Sheets Gantt Chart, depending on the needs of your shoot.
So go into the world and make your own impossible thing.
If you’re interested in learning more about production calendars, you can read all about the basics of making one here, as well as try our production calendar software for free!
